(Not Only Frozen) Fractals All Around
A Discussion of Fractals

It’s time for our souls to spiral in frozen fractals all around, as Idina Menzel iconically sings in Frozen’s “Let it Go.” In particular, this week we’re taking a look at fractals! It’s only fitting that we go back in time to look at the first visualization of a famous fractal.
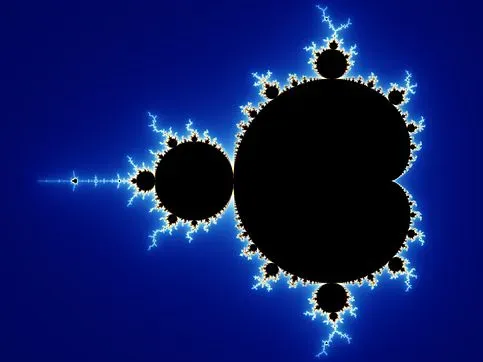
The Mandelbrot set
On March 1st, 1980, in the IBM research center of Yorktown Heights, NY, mathematician Benoit (B.) Mandelbrot caught the first glimpse of what would later be known as the Mandelbrot set, a celebrity in the gorgeous world of fractals. If I had seen it, I might’ve thought it was a computer virus (albeit, a beautiful one), and it kind of is in a way! It has been called the ‘ultimate computer virus’ because of the sheer computational power it requires.
Mandelbrot actually introduced the term fractal in 1975, coming from the Latin word ‘fractus’– meaning broken or irregular. But what really is a fractal? Is there a rigid, formal definition? Let’s see!
The Mandelbrot set demonstrates a core property of fractals: self-similarity. This means that, if you zoom in, you can’t definitively say how much you have zoomed in by because you’ll just see more and more Mandelbrot sets.
But, the notion of a fractal is grounded in iteration, which is applying a formula again and again to the results of previous application, infinitely many times. In the case of the Mandelbrot Set, the formula is x² + c, which seems rather simple at face value.
Let’s look a little closer to see how this works. Let c = 1. We first let x = 0, and plug into the formula to get 0² + 1 = 1. Then we use this as the value of x, plug it in again, and output 1² + 1 = 2. As we keep going, we get the next output of 2² + 1 = 5, and so on.
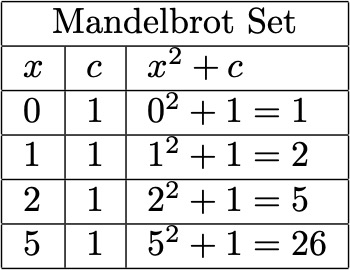
The outputs keep getting bigger and bigger, and the sequence runs off to infinity (much faster than I could ever run).
Let’s now try c = -1. Again, we first let x = 0, and plug this into the formula to get -1. Then this becomes our new x value, and we plug it in again to output 0. As we keep going, we get the next output is -1, then 0, then -1, etc. (Shown in table.)
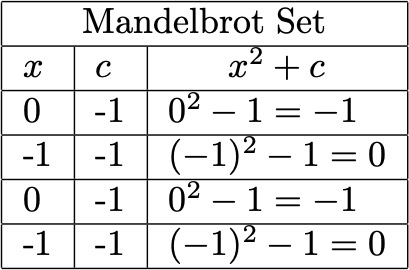
Thus, the sequence just goes between the two values of -1 and 0, meaning it does not run off to infinity, unlike when c = 1. Hence, c = -1 is in the Mandelbrot set.
The Mandelbrot set is made up of these values of c for which this sequence starting at x = 0 does not go to infinity.
But, as usual, this is just one aspect of the set. In this example, we are only looking at the one-dimensional real numbers, which produces only a one-dimensional Mandelbrot set. Instead, we should also look at the formula z² + c, where z and c are complex numbers, and thus two-dimensional (think of the complex plane). This produces a two-dimensional Mandelbrot set, which gives us a lot more to look at.
History of Fractals
Per usual, though Mandelbrot is regarded as the “father of fractals,” this wasn’t the absolute first instance of the notion. French mathematician Henri Poincaré and British mathematician Arthur Cayley had hints of such ideas and fractals, but they didn’t have computational technology to look into it further like Mandelbrot did. And in the past, people were more attracted by normal, smooth curves versus these sorts of rough, irregular ones because these smooth curves could be investigated by differential calculus.
As modern fractals rose to fame (well, mathematical fame), the work of French mathematicians Pierre Fatou and Gaston Julia from around 1919 came to light, as it concerned fractals in the complex plane. They also didn’t have the technology to precisely see their shapes, but this shows how long these types of ideas have been considered.
Fractional Dimension
Another very popular fractal is the Koch curve, also called the Koch snowflake, created in 1904 and named after the Swedish mathematician Niels Fabian Helge von Koch. It is generated by the side of a triangle, adding a triangular bump to the central third of each segment in such a way that makes the fractal symmetric. It is best shown in the following picture:
We can see that each bump is longer than the original segment, meaning the length of the curve increases at each stage, but the curve is always within a circle, so it has a finite area. Thus, it has a finite area despite having an “infinite” perimeter, which is a rather unintuitive idea!
Now, we’re going to talk about the slightly more advanced concept of fractional dimension. You probably already have a concept of dimension: a single point has dimension zero, a line segment is one-dimensional, i.e. has dimension 1, a square has dimension 2, a cube has dimension 3. This is actually known as the Hausdorff dimension (also referred to as the Hausdorff-Besicovitch dimension), named after German mathematician Felix Hausdorff.
But what about the numbers in between these integer dimensions? Is there such a thing as dimension 1.6?
Well, when we look at dimension in terms of scaling, we can describe peculiar objects, like fractals, with non-integer Hausdorff dimensions using its properties of self-similarity and scaling. Hence, we have the idea of fractional dimension, introduced in 1918. Let’s look at the Koch snowflake. Looking at the above picture, we can see that at each iteration, any original line segment is replaced with four self-similar copies that are each ⅓ the length of the original segment. The Hausdorff dimension in this case is the value D such that
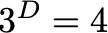
since the scale factor is 3 and the number of self-similar objects is 4. (For example, if we scale a square by a factor of 3, its area is 9 times the original area, i.e. 3² = 9, so it has dimension 2.) Now, we can take the natural log of both sides of this equation to get that log 4 = D log 3, so

Thus, the Hausdorff dimension of the Koch curve is approximately 1.26.
This idea of fractional dimension became a core part of Mandelbrot’s initial definition of a fractal, as he stated in 1982, “A fractal is by definition a set for which the Hausdorff-Besicovitch dimension strictly exceeds the topological dimension.” However, he later deemed this too rigid, and majorly simplified it to: “A fractal is a shape made of parts similar to the whole in some way.”
Another famous fractal is the Sierpiński triangle (or gasket), named after Polish mathematician Wacław Sierpiński. This fractal is constructed from an equilateral triangle by subtracting central triangles repeatedly. Again, this is best demonstrated with a picture:
Applications
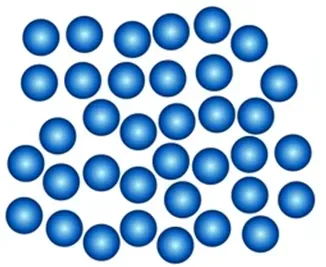
Well, what are the applications of fractals? There are lots and lots, fractals are not just infinitely many pretty faces. They model the natural world all around, in leaves, trees, coastlines, clouds, seashells, etc. Fractals have the unique ability to describe “roughness” in the real world, found anywhere from sound to the human body to the ocean to economics (and Frozen).
But, past its mathematical profoundness, one cannot forget the innate aesthetic beauty of fractals. Early African and Navajo artists recognized this, and implemented such patterns in their art and architecture.
And in 1820, Japanese artist Katsushika Hokusai created the famous “The Great Wave Off Kanagawa,” where the large ocean wave breaks off into smaller and smaller, i.e. self-similar waves.
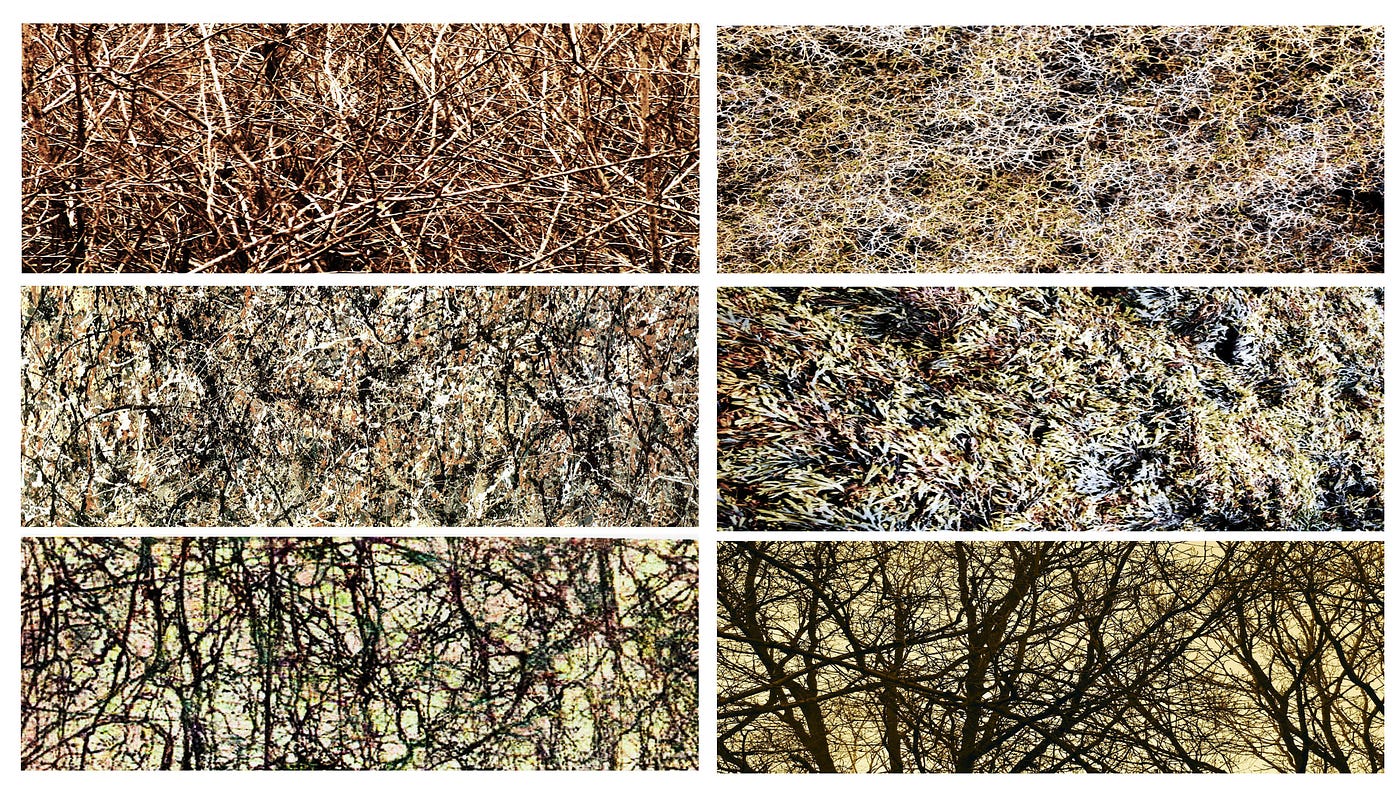
Furthermore, fractal analysis has found fractal patterns in the works of iconic American painter Jackson Pollock, and cognitive neuroscientists have found that his fractals incite the same reaction in people that fractals in nature and computer-generated fractals do.
Yet, there is still so much to be discovered about the nature and applications of fractals, and this is just the start!
So back to our original question: what is a fractal? Well, a lot of mathematicians have differing views on the exact definition of fractals because they can often be too limiting, but they all typically include varying conditions on self-similarity and fractal dimension. But, because of this struggle of encapsulating fractals with a single definition, most mathematicians feel that fractals shouldn’t be confined to a rigid definition–that its beauty transcends such a rigid thing, allowing only for a general characterization.
My favorite description of fractals comes from the father of fractals himself:
“Beautiful, damn hard, increasingly useful. That’s fractals.” — Benoit B. Mandelbrot
Now, you might be (or might not be, if you’re normal) what the B in Benoit B. Mandelbrot’s name stands for. (For any Knives Outs fans, it’s not Blanc unfortunately.) Well, of course it stands for Benoit B. Mandelbrot! That’s fractals. (Kind of.)
(Note: Mandelbrot added the B himself, and it was determined to not actually officially stand for anything, so might as well let it be this!)
Until next time! If you found this interesting, make sure to check out the next column! If you have any questions or comments, please email me at apoorvapwrites@gmail.com
To be the first one to hear about all my new articles, recent events, and latest projects, make sure to subscribe to my newsletter: Letter? I Hardly Know Her