
Modeling an Apocalypse
How we use mathematics to describe a pandemic

This article provides general information about disease modeling. It does not include details specific to COVID-19.
“For God and Country!” has become passée. The new battle cry is “Flatten the curve!” We math nerds are clutching our pocket protectors in anticipation. These are words we can get behind.
So, what do they mean?
The “curve” we are called to flatten is part of an epidemiological model. Such models take our best guesses about a disease and swirl these guesses together. The guesses interact with one another and evolve. We then tweak the guesses and see how our tweaks affect the big picture. We’ll look at one of these models.

The SIR Model
This model is as simple as it gets. Each member of the population falls into one of three categories (or compartments):
- Susceptible (S) — Most of the population begins in this category. Each member has potential either to join the Infected category or to ride out the situation unaffected. The size of this category can only shrink as members become infected.
- Infected (I) — A few members of the population begin Infected. The only direction to go is to the Removed category. The size of this category may grow or shrink, depending on rates of infection and removal.
- Removal (R) — Once an individual is no longer infected, that person joins the final category. This model doesn’t distinguish between a healthy recovery and a death. The size of this category can only grow as the disease progresses through the population.
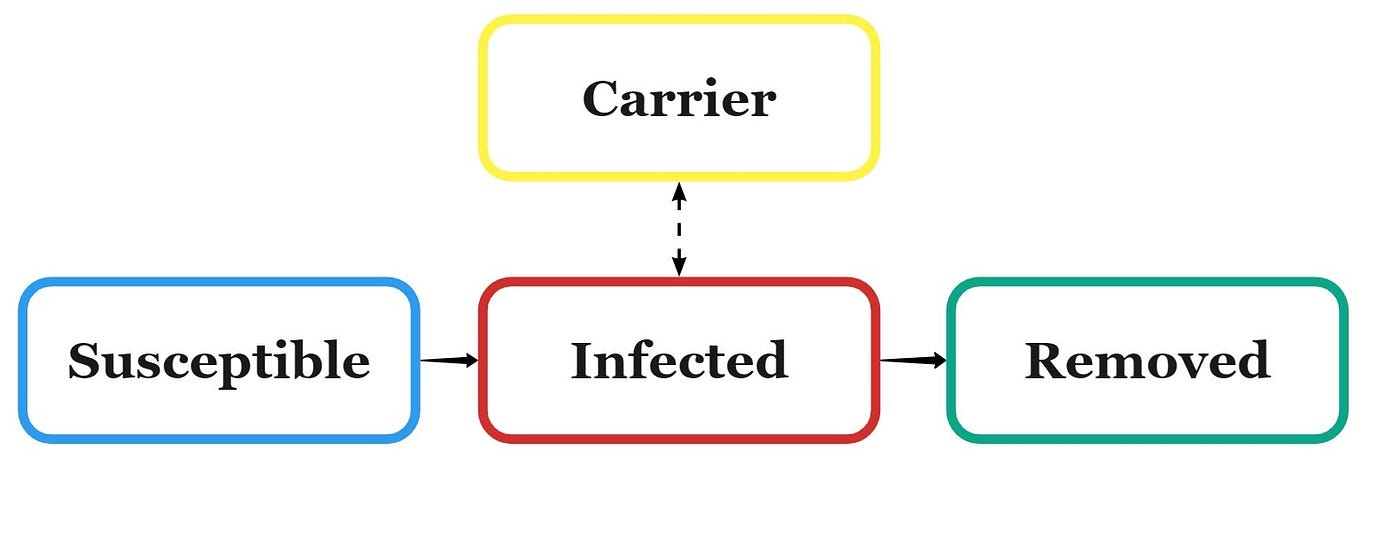
The SIR model assumes the disease flows in one direction: S → I → R. Two educated guesses are necessary to calculate the changes in these variables over time:
- Infection Rate (I-rate) — The infection rate tells us, on average, with how many individuals an infected person shares the disease. This variable is the one we are targeting when we “flatten the curve.” A rate of 1 means the disease is stable. Each person passes the disease to only one other person. Once that person recovers (or dies), they leave behind a replacement. This is like a population where the birth rate is two children per family. The population neither increases nor decreases in size. A rate greater than 1 means the disease is spreading; less than 1 means the disease has lost momentum.
- Removal Rate (R-rate) — The removal rate is a number between 0 and 1, which represents how quickly the infected population recovers.

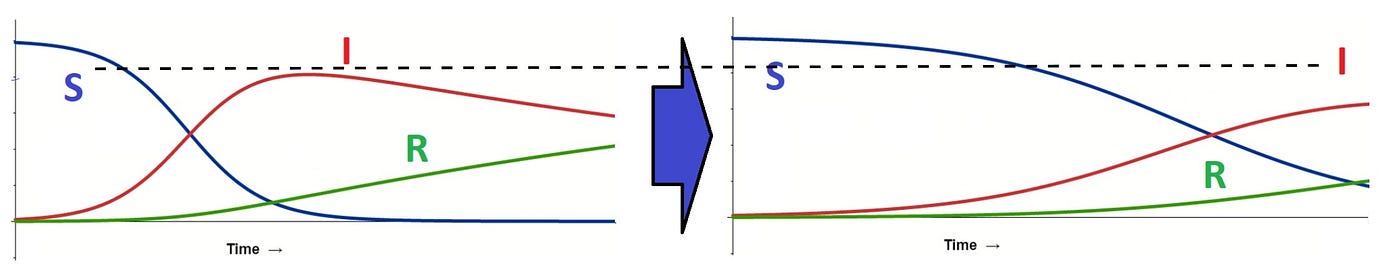
The model is run as a dynamic computer simulation. The size of any one category (S, I, R) continuously updates, depending upon the other two. Three overlapping curves on a graph illustrate this interplay. The so-called curve flattening refers to the effect of reducing the number of individuals each person infects.
Carriers
A modification to the SIR model adds the role of carriers. A carrier recovers from the disease in the sense that she is no longer symptomatic. She has the potential, however, to re-enter the infectious state. Such was the case with the infamous Typhoid Mary.
The SIR model is the most basic of compartmental disease models. Other, more complex models build on it. The next time you hear the battle cry to “Flatten the curve,” you’ll have an idea what that looks like. At least from a mathematical perspective.